Much more detail about the 2011 Census has been released today and I tweeted earlier that the White British population in Tower Hamlets has fallen by some 12 percentage points since the last survey in 2001. Those who classified themselves as White British now make up about 31 per cent of the borough’s 254,000 population (79,000), compared with about 43 per cent a decade ago (84,000).
That was expected. Overall, when other white population groups such as eastern European are considered, the white population is now a minority in Tower Hamlets. It has fallen from 51.4 per cent in 2001 to 45.2 per cent in 2011.
At the same time, the Bangladeshi population has become the largest group by ethnicity (81,000 now versus 65,000 in 2001), but in percentage terms, it is smaller than a decade ago: 33.4 per cent in 2001 to 32 per cent in 2011.
This is largely because the overall population of Tower Hamlets has increased by some 48,000, the main driver of which appears to be those classifying themselves as White Other, eg Europe/US/Aus/NZ/Eastern Europe. In numbers terms, this category has increased from 12,825 to 31,550, and in percentage terms from 6.5 per cent in 2001 to 12.3 per cent now.
The Somali population also seems to have increased significantly, with the ‘Black African’ category tripling in size from about 3,000 to more than 9,000 in a decade.
Constructing a direct comparison between the two census exercises is tricky because some of the ethnic group category names have changed in the 10 years. For example, the 2011 data includes a new ‘White: Gypsy or Irish Traveller’ category, which 10 years ago would have been included in ‘White: other’ or ‘White: Irish’. There are similar changes around the way British Chinese seem to have been counted.
For that reason, I thought I’d post a couple of tables and then manipulate the categories to try and give a reasonable comparison.
Here’s the first table showing the 2011 Census date by group, in numbers and percentages:
| 2011 | Tower Hamlets | |
| All categories: Ethnic group | 254,096 | |
| Asian/Asian British: Bangladeshi | 81,377 | 32.03% |
| White: English/Welsh/Scottish/Northern Irish/British | 79,231 | 31.18% |
| White: Other White | 31,550 | 12.42% |
| Black/African/Caribbean/Black British: African | 9,495 | 3.74% |
| Asian/Asian British: Chinese | 8,109 | 3.19% |
| Asian/Asian British: Indian | 6,787 | 2.67% |
| Asian/Asian British: Other Asian | 5,786 | 2.28% |
| Black/African/Caribbean/Black British: Caribbean | 5,341 | 2.10% |
| White: Irish | 3,863 | 1.52% |
| Black/African/Caribbean/Black British: Other Black | 3,793 | 1.49% |
| Other ethnic group: Any other ethnic group | 3,214 | 1.26% |
| Mixed/multiple ethnic group: Other Mixed | 3,053 | 1.20% |
| Mixed/multiple ethnic group: White and Asian | 2,961 | 1.17% |
| Mixed/multiple ethnic group: White and Black Caribbean | 2,837 | 1.12% |
| Other ethnic group: Arab | 2,573 | 1.01% |
| Asian/Asian British: Pakistani | 2,442 | 0.96% |
| Mixed/multiple ethnic group: White and Black African | 1,509 | 0.59% |
| White: Gypsy or Irish Traveller | 175 | 0.07% |
And here’s the 2001 data in the same format:
| 2001 | Tower Hamlets | |
| All | 196,106 | |
| White: British | 84,151 | 42.91% |
| Asian or Asian British: Bangladeshi | 65,553 | 33.43% |
| White: Other White | 12,825 | 6.54% |
| Black or Black British: Black African | 6,596 | 3.36% |
| Black or Black British: Black Caribbean | 5,225 | 2.66% |
| White: Irish | 3,823 | 1.95% |
| Chinese or other ethnic group: Chinese | 3,573 | 1.82% |
| Asian or Asian British: Indian | 3,001 | 1.53% |
| Chinese or other ethnic group: Other ethnic group | 2,312 | 1.18% |
| Asian or Asian British: Other Asian | 1,767 | 0.90% |
| Mixed: White and Black Caribbean | 1,568 | 0.80% |
| Asian or Asian British: Pakistani | 1,486 | 0.76% |
| Mixed: White and Asian | 1,348 | 0.69% |
| Mixed: Other Mixed | 1,168 | 0.60% |
| Black or Black British: Other Black | 921 | 0.47% |
| Mixed: White and Black African | 789 | 0.40% |
And here’s an attempt to compare between the two decades. With one exception, I’ve used the 2011 categories for the descriptions – I combined ‘White: Gypsy or Irish Traveller’ into ‘White: Irish’. And from the 2001 data, I combined the two Chinese categories into the 2011 ‘Asian/Asian British Chinese’ description. That left two categories in 2011 that don’t seem to have any easy equivalent in 2001 – ‘Other ethnic group: Arab’, and ‘Other ethnic group: Any other ethnic group’ – so I’ve just included them without any comparison to 2001.
(I can’t find a way in WordPress to paste this Excel table in the way I want to, so for an easier way to read it, click on the image below.)
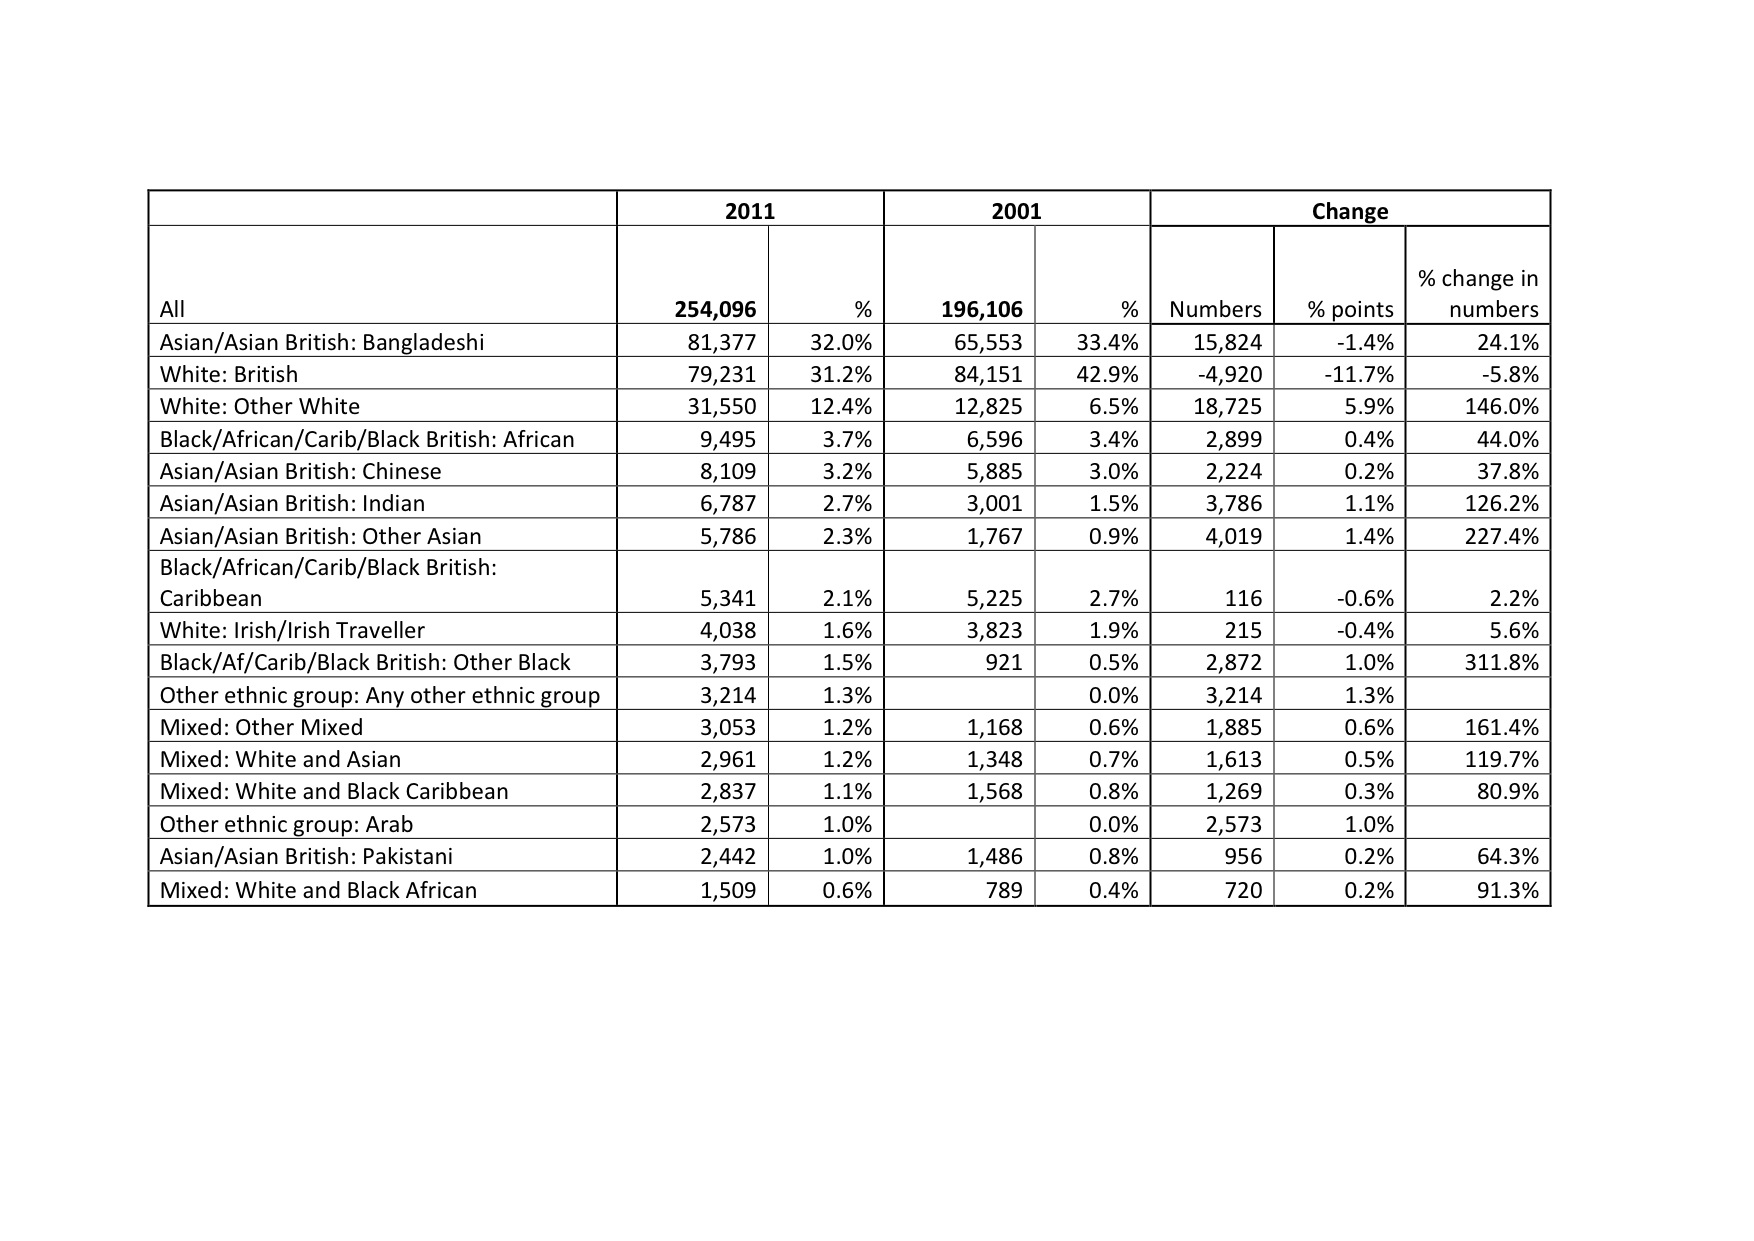
| 2011 | 2001 | Change | |||||
| All | 254,096 | % | 196,106 | % | Numbers | % points | % change in numbers |
| Asian/Asian British: Bangladeshi | 81,377 | 32.0% | 65,553 | 33.4% | 15,824 | -1.4% | 24.1% |
| White: British | 79,231 | 31.2% | 84,151 | 42.9% | -4,920 | -11.7% | -5.8% |
| White: Other White | 31,550 | 12.4% | 12,825 | 6.5% | 18,725 | 5.9% | 146.0% |
| Black/African/Carib/Black British: African | 9,495 | 3.7% | 6,596 | 3.4% | 2,899 | 0.4% | 44.0% |
| Asian/Asian British: Chinese | 8,109 | 3.2% | 5,885 | 3.0% | 2,224 | 0.2% | 37.8% |
| Asian/Asian British: Indian | 6,787 | 2.7% | 3,001 | 1.5% | 3,786 | 1.1% | 126.2% |
| Asian/Asian British: Other Asian | 5,786 | 2.3% | 1,767 | 0.9% | 4,019 | 1.4% | 227.4% |
| Black/African/Carib/Black British: Caribbean | 5,341 | 2.1% | 5,225 | 2.7% | 116 | -0.6% | 2.2% |
| White: Irish/Irish Traveller | 4,038 | 1.6% | 3,823 | 1.9% | 215 | -0.4% | 5.6% |
| Black/Af/Carib/Black British: Other Black | 3,793 | 1.5% | 921 | 0.5% | 2,872 | 1.0% | 311.8% |
| Other ethnic group: Any other ethnic group | 3,214 | 1.3% | 0.0% | 3,214 | 1.3% | ||
| Mixed: Other Mixed | 3,053 | 1.2% | 1,168 | 0.6% | 1,885 | 0.6% | 161.4% |
| Mixed: White and Asian | 2,961 | 1.2% | 1,348 | 0.7% | 1,613 | 0.5% | 119.7% |
| Mixed: White and Black Caribbean | 2,837 | 1.1% | 1,568 | 0.8% | 1,269 | 0.3% | 80.9% |
| Other ethnic group: Arab | 2,573 | 1.0% | 0.0% | 2,573 | 1.0% | ||
| Asian/Asian British: Pakistani | 2,442 | 1.0% | 1,486 | 0.8% | 956 | 0.2% | 64.3% |
| Mixed: White and Black African | 1,509 | 0.6% | 789 | 0.4% | 720 | 0.2% | 91.3% |
So, what are the main headlines?
1. The overall population of the borough has increased by some 58,000 in 10 years, a rise of about 29.6 per cent, or 16 people a day.So, what are the main headlines?
2. The British Bangladeshi/Bangladeshi population is now the largest single group in the borough, but it has fallen as a percentage of the overall total;
3. The overall White population of Tower Hamlets is now a minority in the borough, comprising 45.2 per cent of the population.
4. The White British population is the only population group to have fallen in terms of actual numbers – by almost 5,000 (either through having left the borough, and/or deaths outweighing births);
5. The ‘White Other’ population has boomed. I suspect this is due to an influx of newcomers from Europe/eastern Europe and bankers from North America.
I’d imagine the EDL will be most disappointed with these figures. How frustrating for them to see that Bangladeshis aren’t exactly “over-breeding”. I wonder if instead the EDL will turn its fire on the ‘White Other’ population that seems to be fuelling the small boom in numbers.
Somehow, I doubt it.
Your observations are welcome…and please correct any glaring mistakes I’ve made! (Ethnic group breakdowns by age category are not yet available, I’m afraid.)


A point worth raising is that these figures depend on people completing the census form. Ever since 2001 delivering and returning the census form has been done by post (rather than in person at the door) and because of this it has become much more easy to avoid appearing on it.. I would suggest that significant numbers of people in this borough did not complete a census form who should have done – I know of a number of proud individuals myself. I wonder if anyone has given any thought as to which population groups are more likely to complete the census and which are more likely to avoid completing the census. I would suggest that it is likely higher numbers of people who were either here illegally or unsure of their immigration status would avoid putting their name on a government census form. In large enough numbers this would distort the figures.
Perhaps only people who are on the last census could get a ballot paper. I’m sure that would encourage participation!
Census officers were employed across the country to go door to door to chase people to complete their forms. The Office for National Statistics reckon to have got at least 90% of households completing forms. It is a criminal offence not to complete a census form so the people who you know have nothing to be proud of.
I think some boroughs have realised this and run supplementary studies which use administrative data instead.
The one for Hackney includes the following:
‘The population of Hackney in March 2011 is estimated to be 237,646, based on administrative data. This represents a substantial discrepancy with official figures. The administrative count of 237,646 is over 18,000 persons higher than the ONS 2010 mid-year estimate, and 3,400 persons higher than the GLA’s estimate for the same year.
Click to access estimating-and-profiling-the-population-of-hackney.pdf
The EDL (and other nationalist parties) don’t seem to hold back on opposing Eastern European immigration so they might well oppose the growth in White Other category. It won’t occur to them that the growth in that category will have been caused partly by the gentrification of the whole borough, the redevelopment of Spitalfields and the City borders and the growth in the Canary Wharf community (the Russian businessman who was shot in the street earlier this year won’t be the only wealthy East European in the area). And then there’s all the Commonwealth citizens (Australia, Canada, New Zealand) who are living here to provide essential services.
Well, knowing how it works in our borough this would probably encourage over-participation. In order to secure higher number of ballot papers and not to lose certain benefits linked to people who are either dead or back in the country of origin, certain population groups might be too proactive…
So Bangladeshi’s are 32% of Tower Hamlets population, what percentage of Councillors are Bangladeshi?
Bangladeshis are only 32% of LBTH population but 57% of Councillors and 100% of Council leadership. Work that one out!
Making digs at the mayor for having a 100% bangladeshi leadership isn’t really fair when the Labour party bans Cllrs from sitting in his cabinet. There are at least 4 white Cllrs in Labour Group who would be perfectly happy to serve in his cabinet but are prevented from doing so. If you look across at Newham there are only 3 ethnic minority Cllrs in Robin Wales’ executive when there is a very strong field. Two of them speak broken English and contribute nothing and have their portfolios run by other people.
But Lutfur could have fielded a non-Bengali candidate in the Spitalfields by-election who could then have joined his cabinet and made it a bit more representative…. but Lutfur chose not to and you have to wonder why he chose not to.